

Spread the word:


When a venture capital firm reviews a pitch deck, they spend an average of three minutes scanning the entire presentation. They are not reading your densely packed paragraphs; they are looking for the story told by your numbers. If your financial projections, Customer Acquisition Cost (CAC), and Monthly Recurring Revenue (MRR) are buried in messy spreadsheets or default Excel pie charts, the investor will lose confidence in your operational clarity.
A premium Startup Pitch Deck treats data visualization as a core UI/UX discipline. The goal is to reduce the investor’s cognitive load, making your startup’s growth trajectory instantly recognizable and undeniably compelling.
The Principle of Chart Minimalism
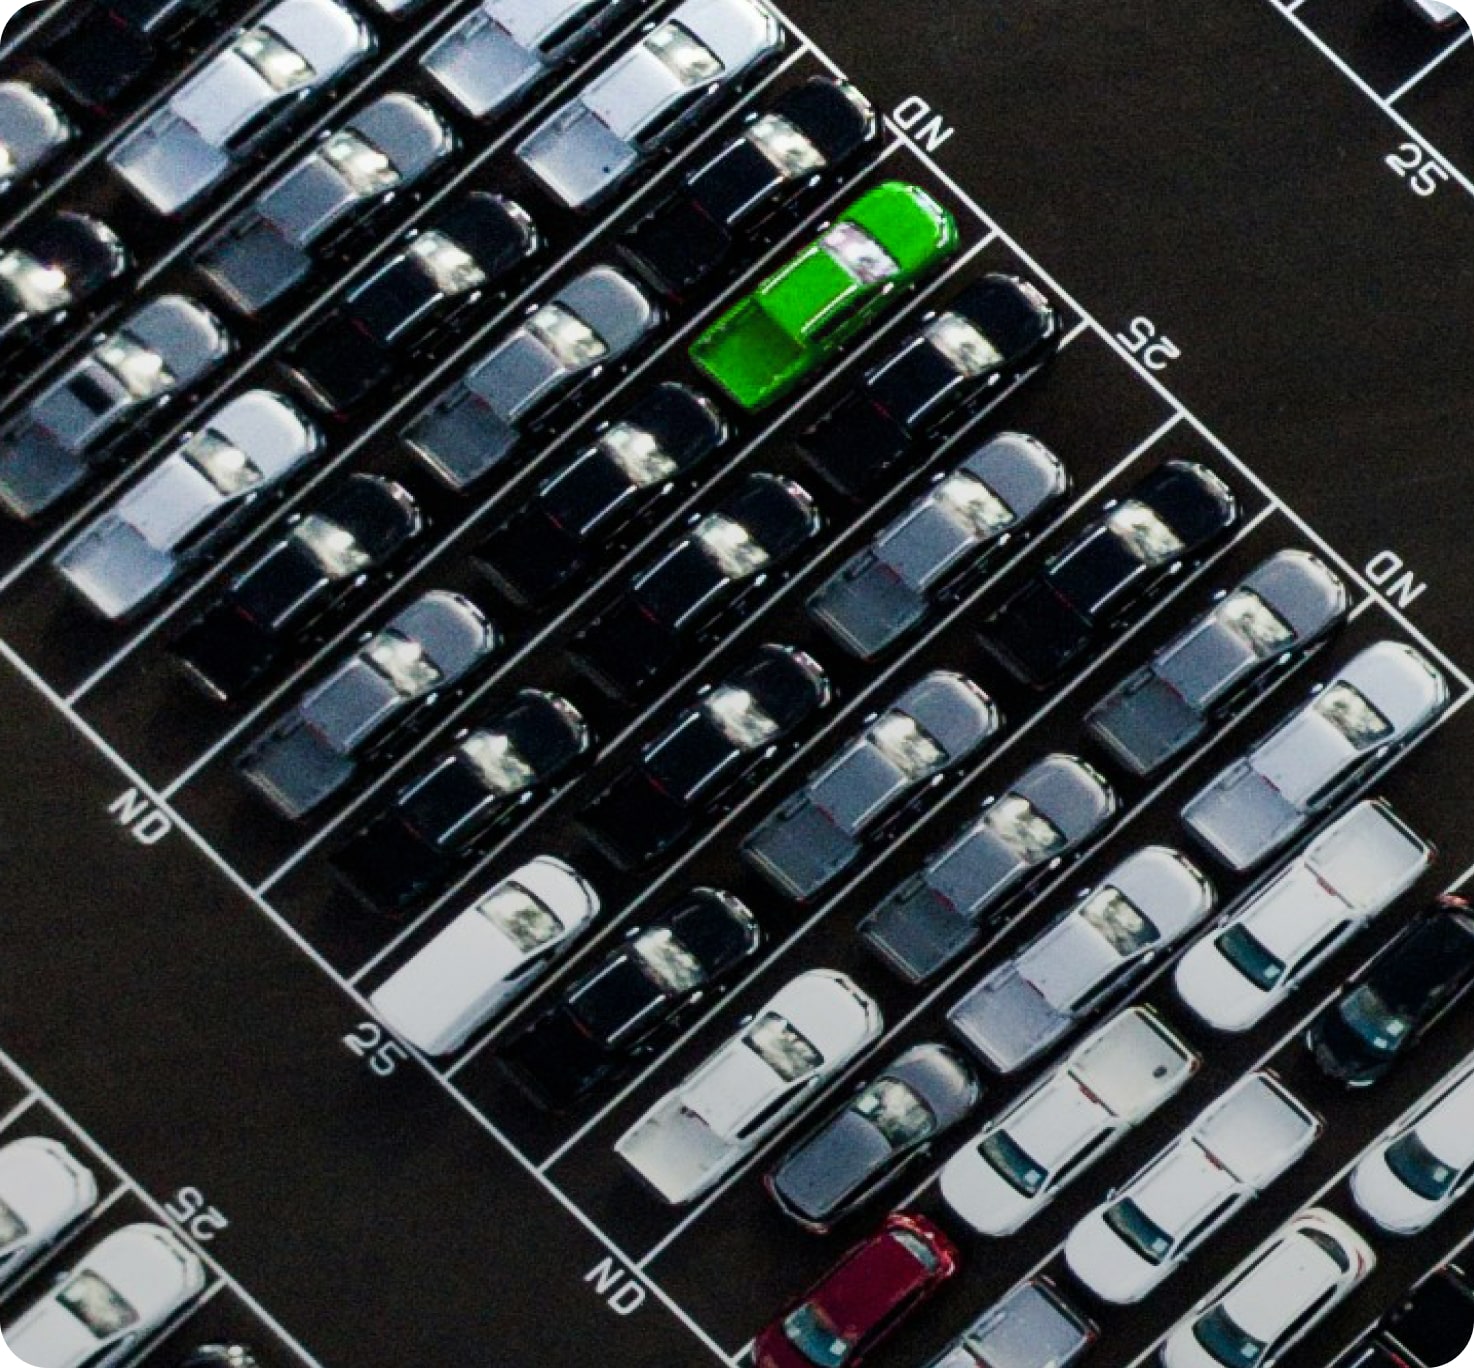
Default charting tools add massive amounts of “chart junk”—unnecessary gridlines, redundant legends, 3D effects, and excessive axis labels. To design an enterprise-grade slide, you must strip away everything that does not directly support the data’s core message. Use a single, high-contrast brand color to highlight the specific growth metric (like the current quarter’s MRR spike) while muting historical data in soft grays. This directs the investor’s eye precisely where you want it to go.
Visualizing the Unit Economics
Unit economics (LTV vs. CAC) are the heartbeat of a Series A or Series B pitch. Do not just list these numbers as bullet points. Visualize them as a ratio or a scaling bar chart that clearly demonstrates the widening gap between what it costs to acquire a customer and the revenue they generate. Applying the strict typographical hierarchies we use in Data-Driven UI/UX for SaaS Dashboards ensures your financial slides project institutional maturity and rigorous engineering discipline.
Frequently Asked Questions (FAQ)
1. Why is data visualization critical in a startup pitch deck? Data visualization is critical because venture capitalists evaluate hundreds of decks a week. Clear, beautiful charts instantly communicate complex financial health and growth velocity, allowing investors to grasp the startup’s potential without reading heavy text.
2. What is “chart junk” in presentation design? Chart junk refers to unnecessary visual elements in a graph, such as heavy background grids, 3D shadows, excessive axis ticks, and redundant borders. Removing chart junk reduces cognitive load and makes the actual data stand out.
3. How should MRR (Monthly Recurring Revenue) be visualized? MRR is best visualized using a clean, cumulative bar chart or a smooth line graph. The most recent data points or projected growth should be highlighted using the company’s primary accent color, while historical data remains in a neutral shade.
4. What are the best fonts for pitch deck financial slides? Financial slides must use highly legible, geometric sans-serif fonts (like Inter or Roboto) equipped with tabular figures. Tabular figures ensure that numbers in tables and charts align perfectly vertically, making complex financials easy to scan.
5. Should a pitch deck include raw spreadsheet data? No. Raw spreadsheet data belongs in the data room (the due diligence folder provided to interested investors). The pitch deck itself should only contain high-level, synthesized visualizations that highlight the key performance indicators (KPIs).
6. How do you visualize a competitive advantage? Instead of a standard feature-comparison checklist, visualize your competitive advantage using a two-axis positioning matrix (e.g., “Speed to Deploy” vs. “Enterprise Security”) to clearly map out the market landscape and position your startup in the dominant top-right quadrant.
7. Can good design mask bad financial data? No. Good design clarifies data, it does not hide reality. If unit economics are fundamentally flawed, a beautiful chart will only highlight that flaw faster. The purpose of design is to remove friction so strong data can speak for itself.